For this team project we had the task of using a data set to answer a question. We choose to use a data set of all FBS Football games from 2002-2025 and answer the question of who would win in a hypothetical matchup between two FBS Football teams across the past 25 years. We had to use Industrial Engineering skills across the board whether that involved working as a team and planning the project, or the process of building a model by passing data through a system until the desired information has been pulled out and used to make conclusions.
In the development of this project I had to practice multiple skills such as how tasks would be delegated to a team, and then also more technical java skills. First, I think that for any team project to work well roles need to be defined and tasks need to be delegated. Without this structure things can become unorganized and jobs will be left unfinished or not up to the project standards. Being able to practice this skill in a lower pressure situation before I need it daily in the job market was a vital experience. In terms of the technical code itself, I worked in specific with processing the data to prepare it for the model and then building the user interface. With the pre-processing of data I used tools such as tablesaw because the dataset was so large that columns needed to be lableled and sorted. This code required many different java classes because of all of the different actions we wanted to do. The data follows a pipeline from aggregating the data into the different seasons, then building specific data profiles. Working as a team on GitHub took some getting used and required good communication to ensure that we were not pushing commits over each others code. These skills are vital for me to practice and using them in a school team project is a good way to do that.
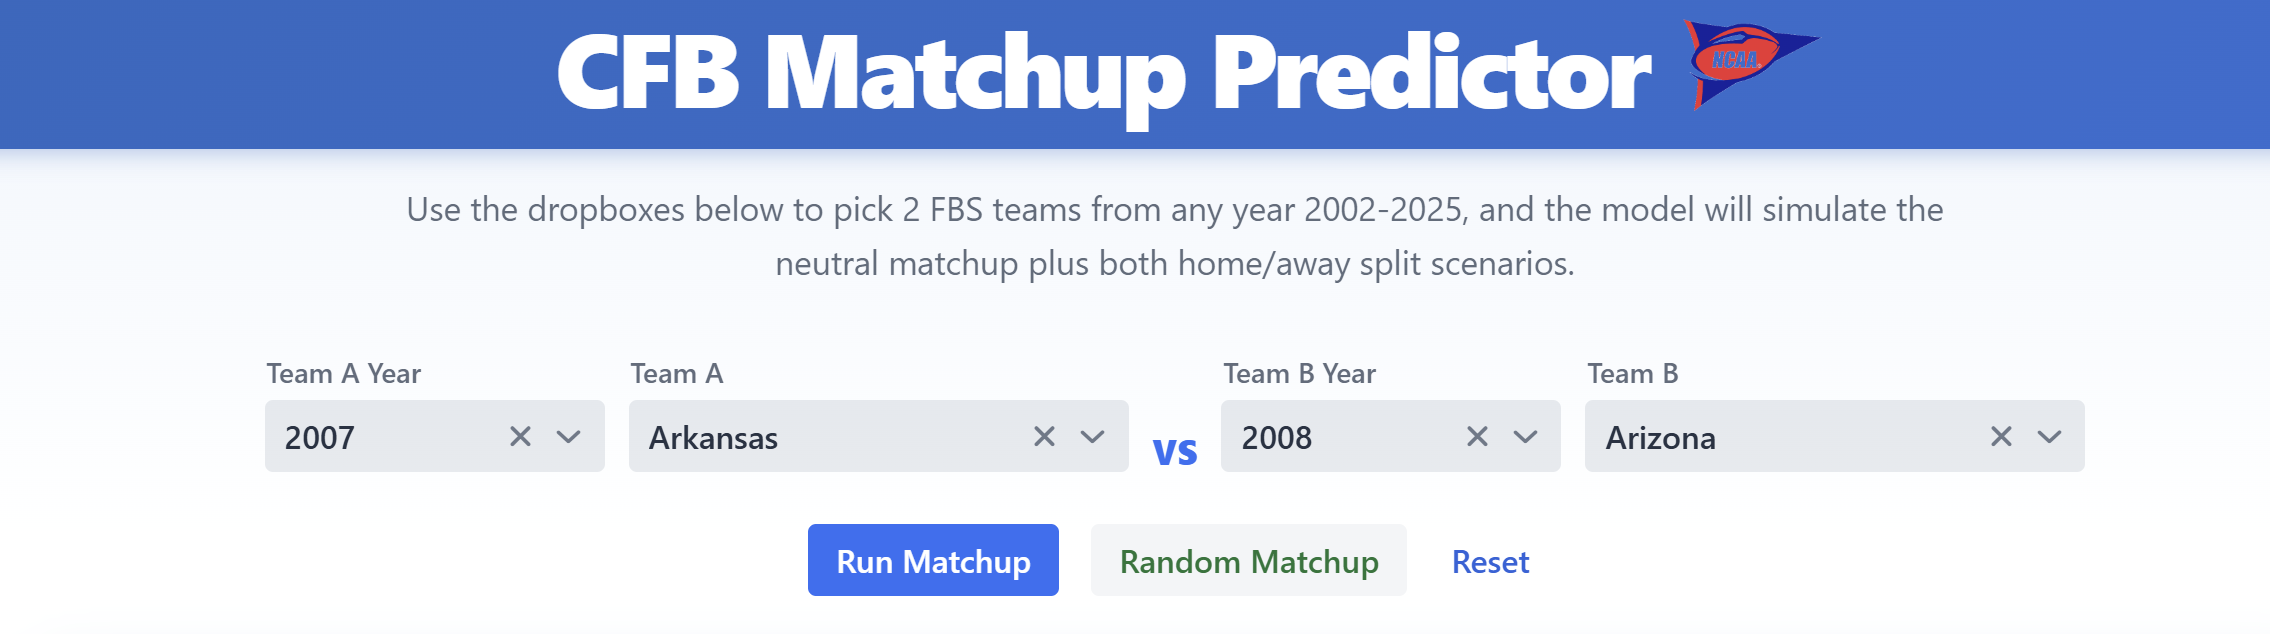
The original goal was to build a model where the user can pick any team from the past 25 years, for example 2007 Arkansas, and match that team up in a hypothetical matchup with any other team and predict the winner and by how much. When we first started we were using a style where we averaged the home and away scores together in order to predict the neutral field outcome. Halfway through we realized that in order to take into account all factors of a game that contribute to victory. For example, home field advantage plays a big role in the outcome of a game so we decided to use the stats for home and away and build two seperate versions of each team. So 2007 Arkansas if it was being modeled would turn into a 2007 Arkansas home team, a 2007 Arkansas neutral field team, and a 2007 Arkansas away team. When spliting metrics up like this when a hypothetical matchup is entered by the user we can give the outcomes based on who has home field advantage and things of that nature.
Once we have these profiles we use a probabilistic model that takes into account what we are calling edges between teams. An edge is a statistical area where one team holds an advantage over the other, based on the margin of this edge a weight is assigned to that edge in determining a winner. Many edges are used, for example comparing two offensive efficiency metrics and taking the difference of them we find a margin, or an edge, between those two teams in that given metric. The wider the gap, and the more important the metric, the more weight that is assigned to the edge. The team with the greater overall edge, the culmination of all the edges, is the team that will come to victory.
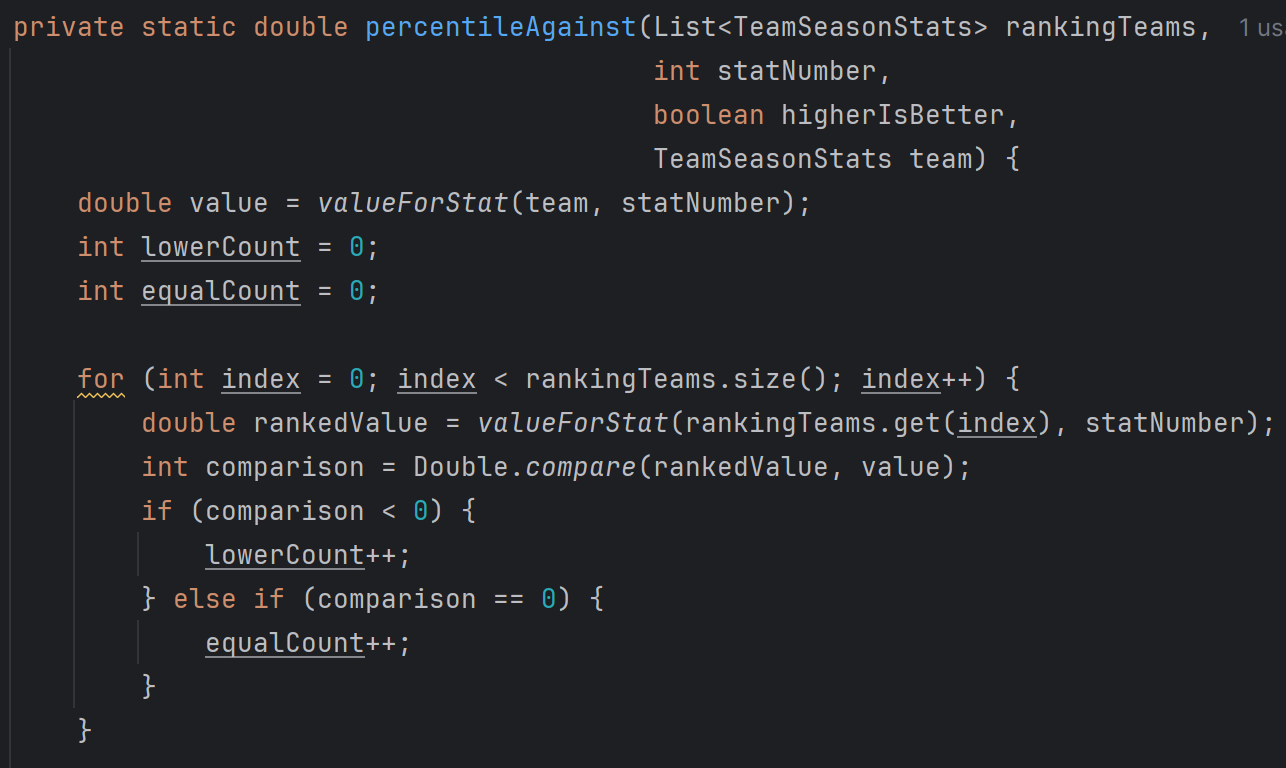
A big obstacle with predicting across eras is the need for normalizing the data this is because offensive and defensive schemes have changed so much in the past couple years. We used team profiles for a specific season to accomplish this, by taking the stats of all teams for a season and placing them on a scale from 0 to 1 we can arrange teams based on a percentile. Once we have these percentiles we can compare them across the different years, or eras, that are captured within our prediction model.
The project far exceeded my expectations that I came into it with. Taking the raw data and turning it into a fairly accurate, from what I have tested, probabilistic prediction model. The part that surprised me the most was when we were working on the Vaadin features, it turned out much better than I was expecting and I am proud of that.
Code Breakdown:
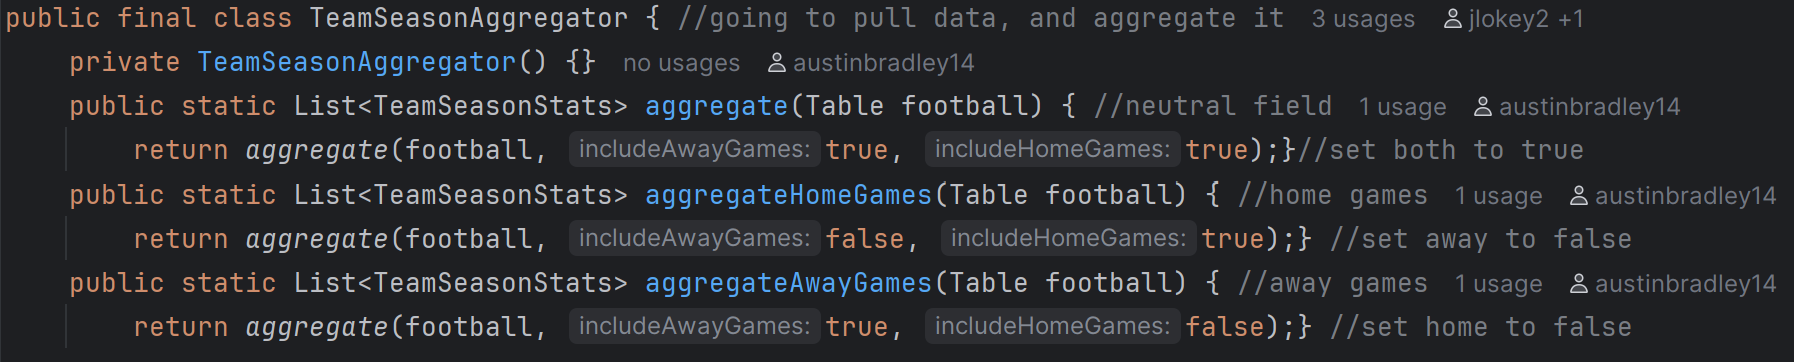
This code shows how the different aggregations are done. When recording the home and away games later on all stats are recorded as if they were “at home” or “away”. This is a key functionality in order to predict and show how a game could be an upset.
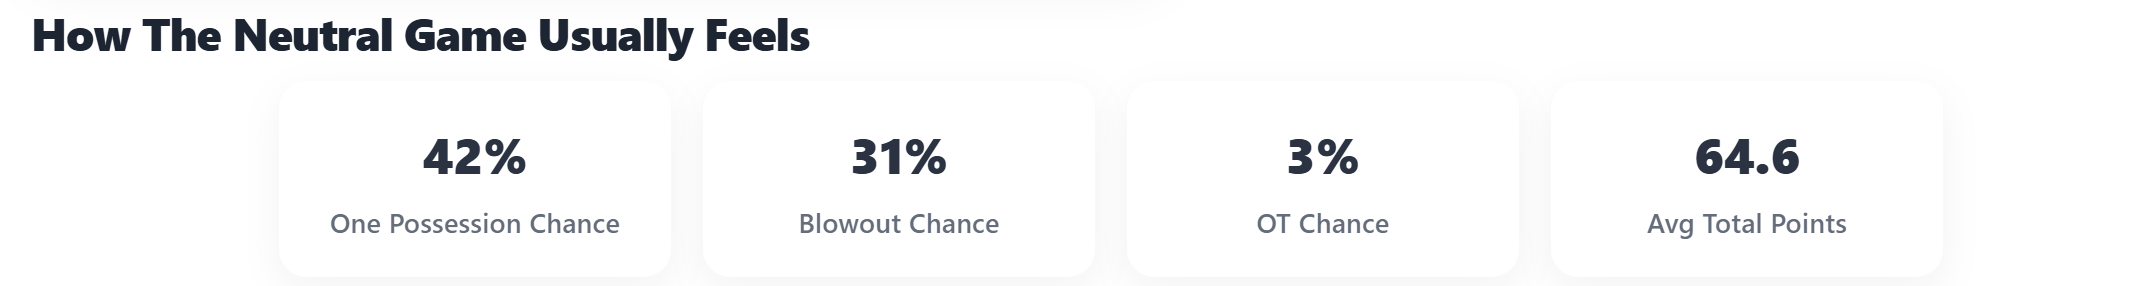
This gives a feel to the user of how the game is going to play out, when looking at this display you can pretty easily understand the sort of game you would we watching. For example this 2007 Arkansas vs 2008 Arizona game would be fairly high scoring with a pretty high probability of staying close, making for an entertaining game.
Reflections on the project:
• What did you learn about object-oriented design, collaboration, or debugging?
I learned how important it is to have a predetermined flow that the project needs to follow. With all of the data that we needed to sort out and assign into different classes it was extremely important to stay organized as possible in the coding environment. With debugging Vaadin is an extremely testing process that involves a lot of back and forth, but by using the libraries, and tutorials to help I was able to figure it out.
• What did you contribute that you’re proud of?
I am most proud of my work on the season normalizer, the first attempt that I had made for it was a smaller scale version that was only used across a handful of stats, but when it was expanded fully out, it became a pretty seamless code and honestly not terrible in terms of the required logic. I also got to work some on the Vaadin which I felt was really intriguing because its hard to know exactly what something is going to look like until you run it, and getting it to work is incredibly satisfying and rewarding.
• In what ways did you grow as a coder, teammate, or problem-solver?
As a coder, I became more confident in being able to just start completely from scratch with an idea. In the past we normally have a sort of template that we build off of, but with this project that was not at all the case. It grew me into thinking more creatively and less about meeting a certain output of a smaller assignment. As a teammate I believe that I improved in areas such as delegation, and knowing when to take command. In the past I have found it hard to delegate tasks to teammates as I will usually just put my head down and get it done but this project was big enough to where I couldn’t do that.
• What do you now feel more confident about that you didn’t at the start?’
I am much more confident in my ability to take a complex an large dataset and turn it into something that a user can interact with. Being able to take information that someone knows nothing about and turning it into a service or tool that people can use is something I have not really done before. So this project grew me in that regard for sure, and now I know I can take on large projects even if they seem challenging at first.